Funnel Chart Maker
Paste data from Excel to create custom sales and marketing funnel diagrams instantly in your browser.
Visualize Process Retention and Sales Pipeline Drop-Offs
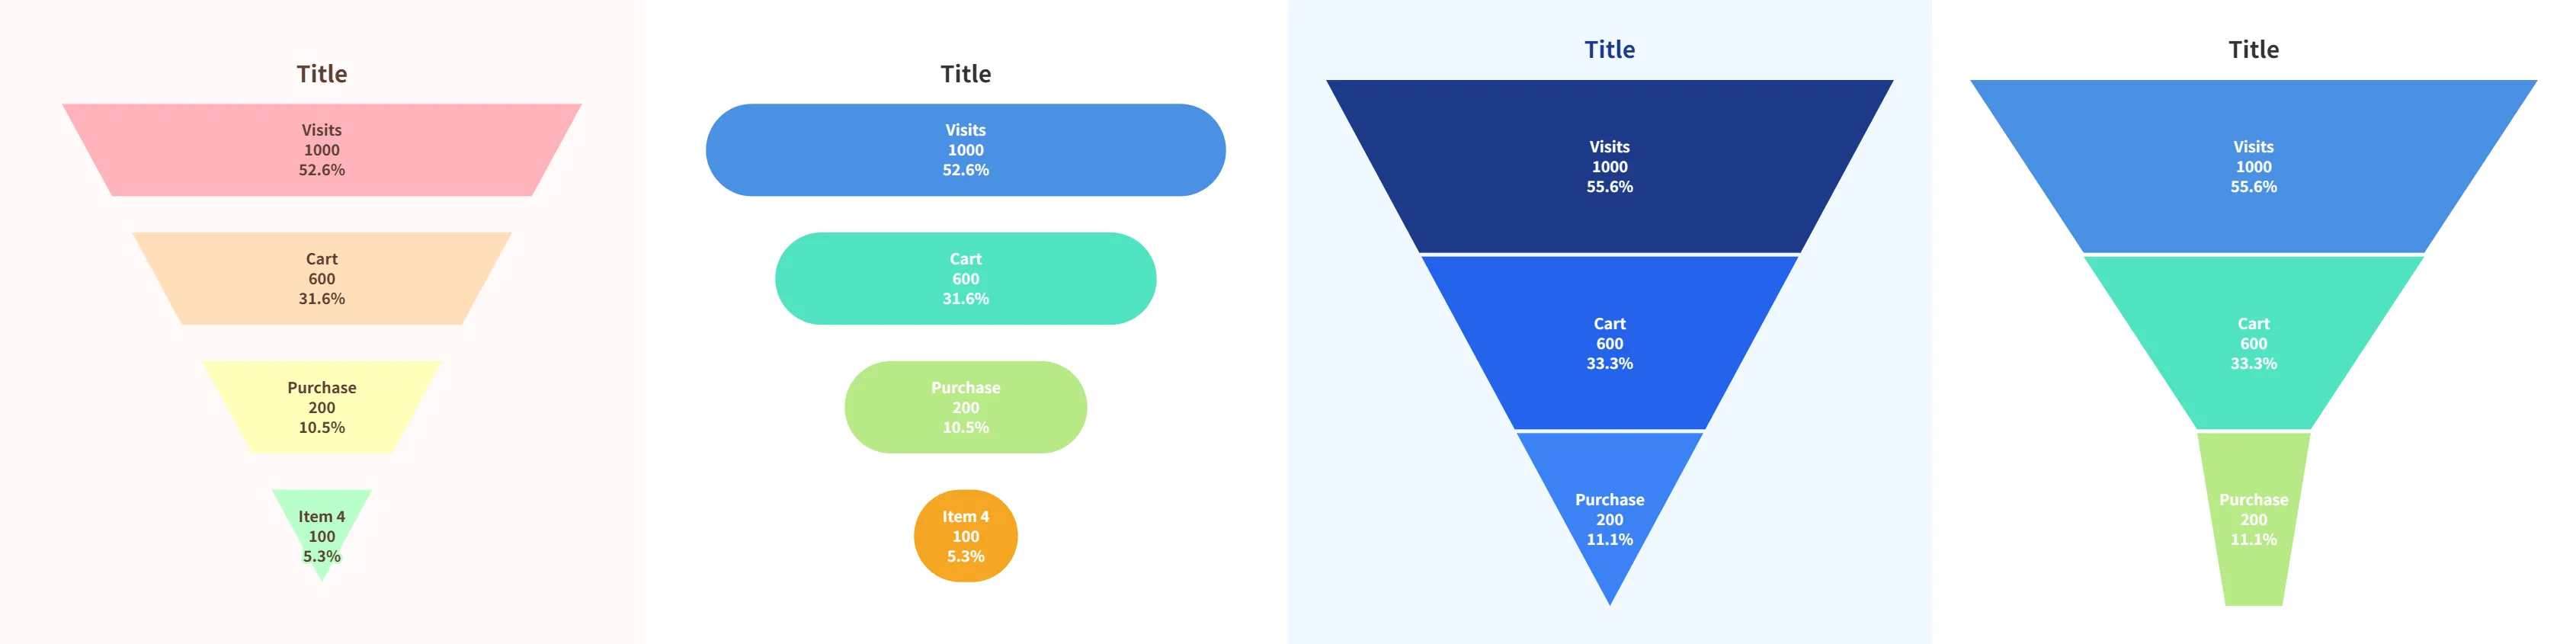
Build custom funnel charts and conversion graphics directly in your browser. Visualize stage-by-stage retention, pipeline conversions, and drop-offs across sales, marketing, and recruitment. Paste tabular data directly from Excel or Google Sheets, calculate previous-step retention rates automatically, and choose from 4 geometric styles including inverted pyramid and classic funnel. Copy charts to clipboard for instant pasting into PowerPoint slides or download high-resolution PNG images. All data processing occurs locally in your browser to keep business metrics completely private.
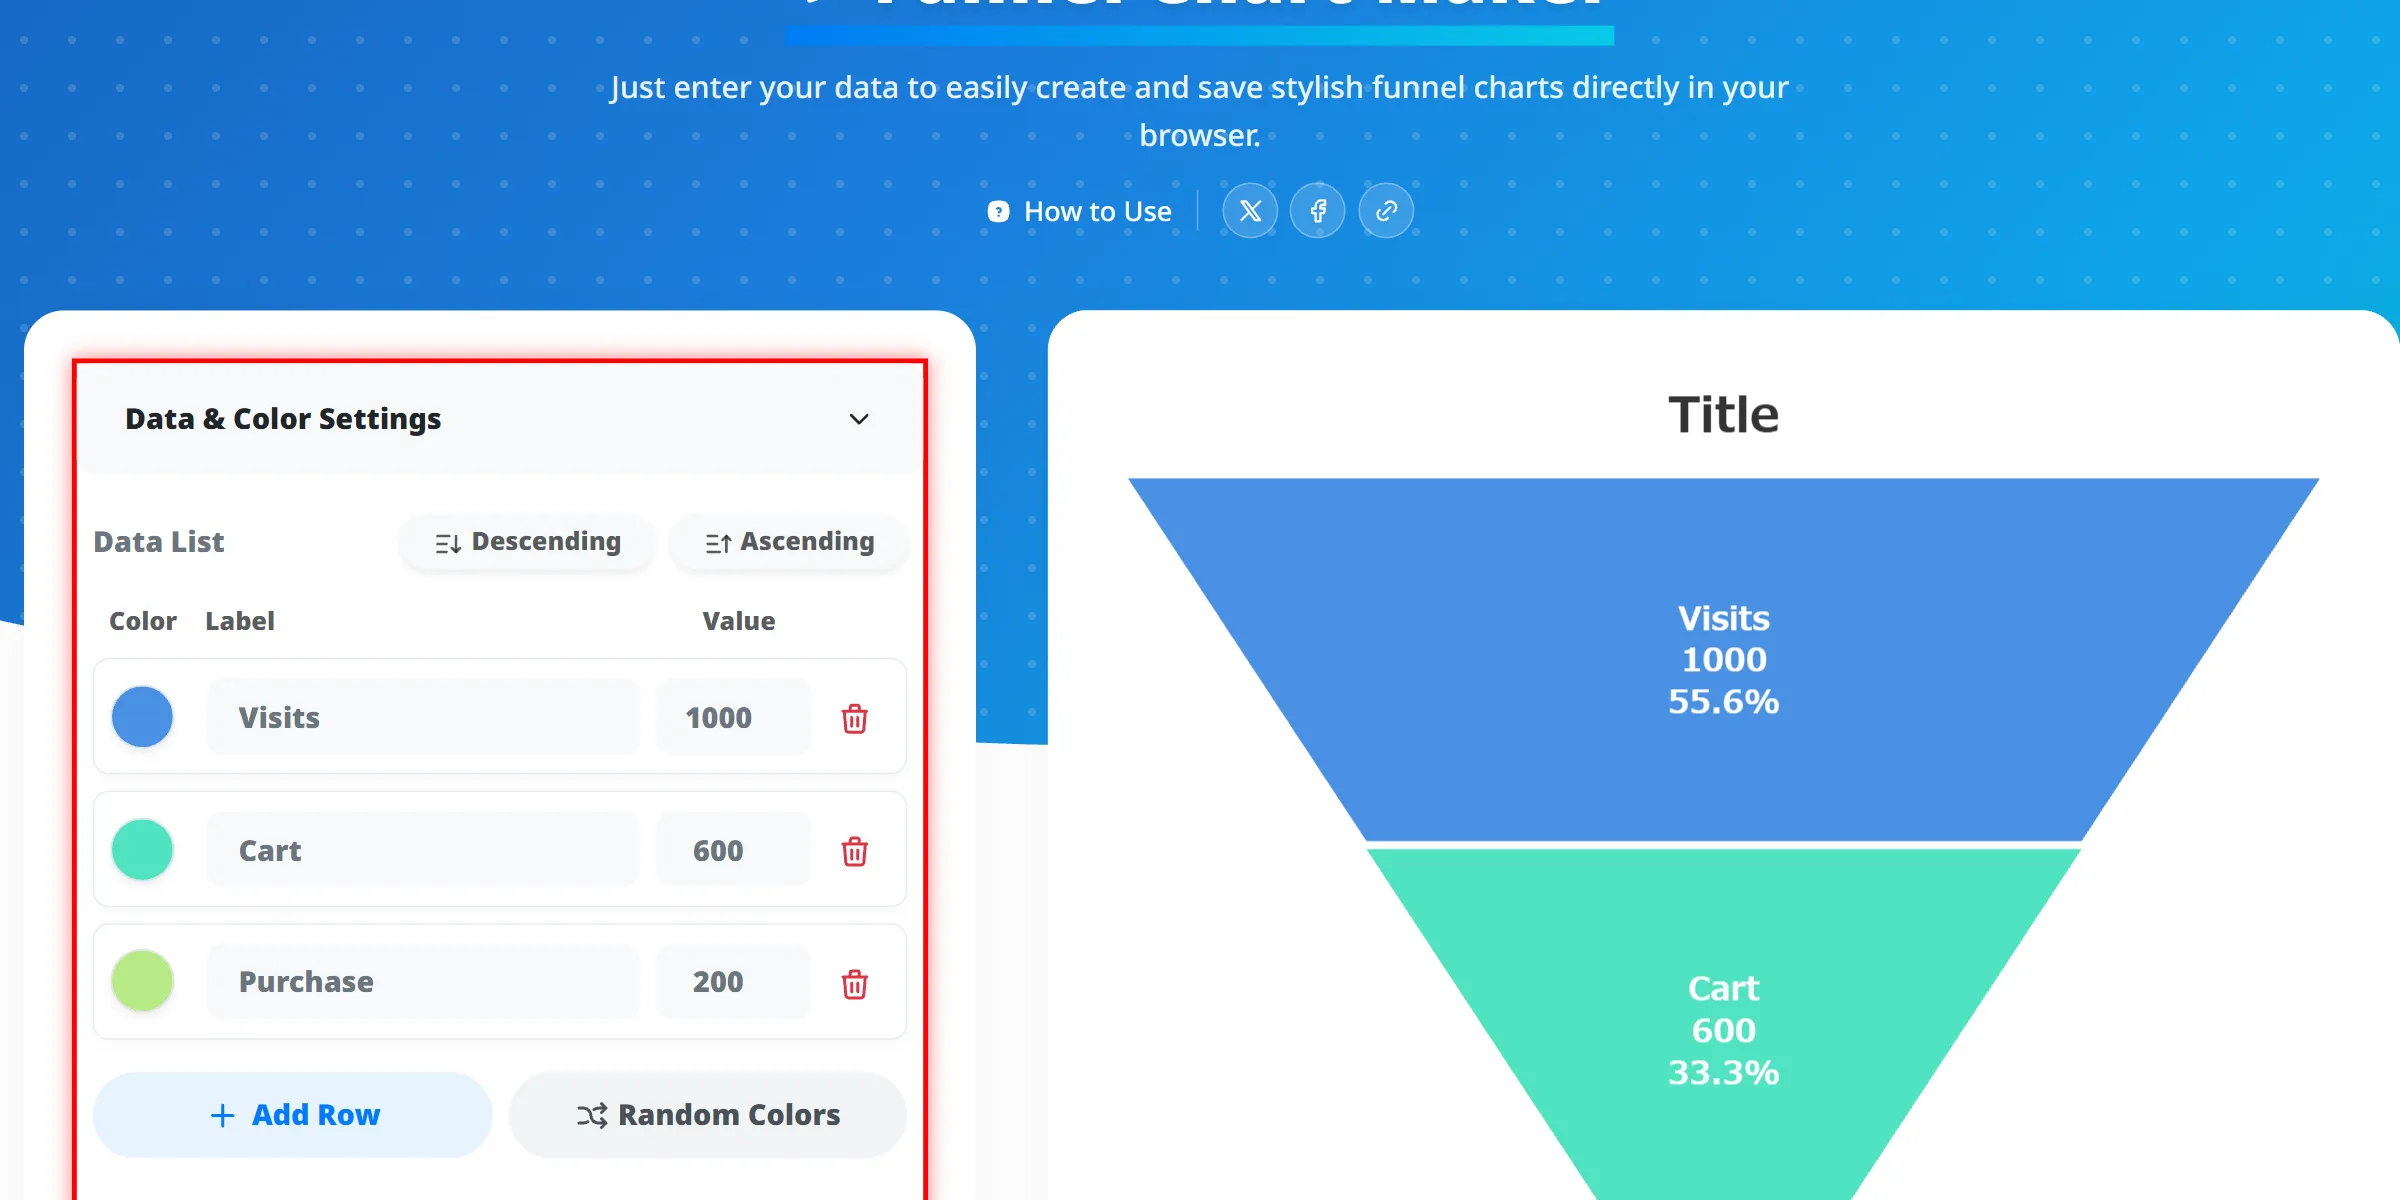
Input Data (Paste from Excel)
Enter stage labels and values into the data table. Click "Paste from Excel" to import two-column tabular data directly from spreadsheets. Add rows, reorder stages, or generate random color palettes.
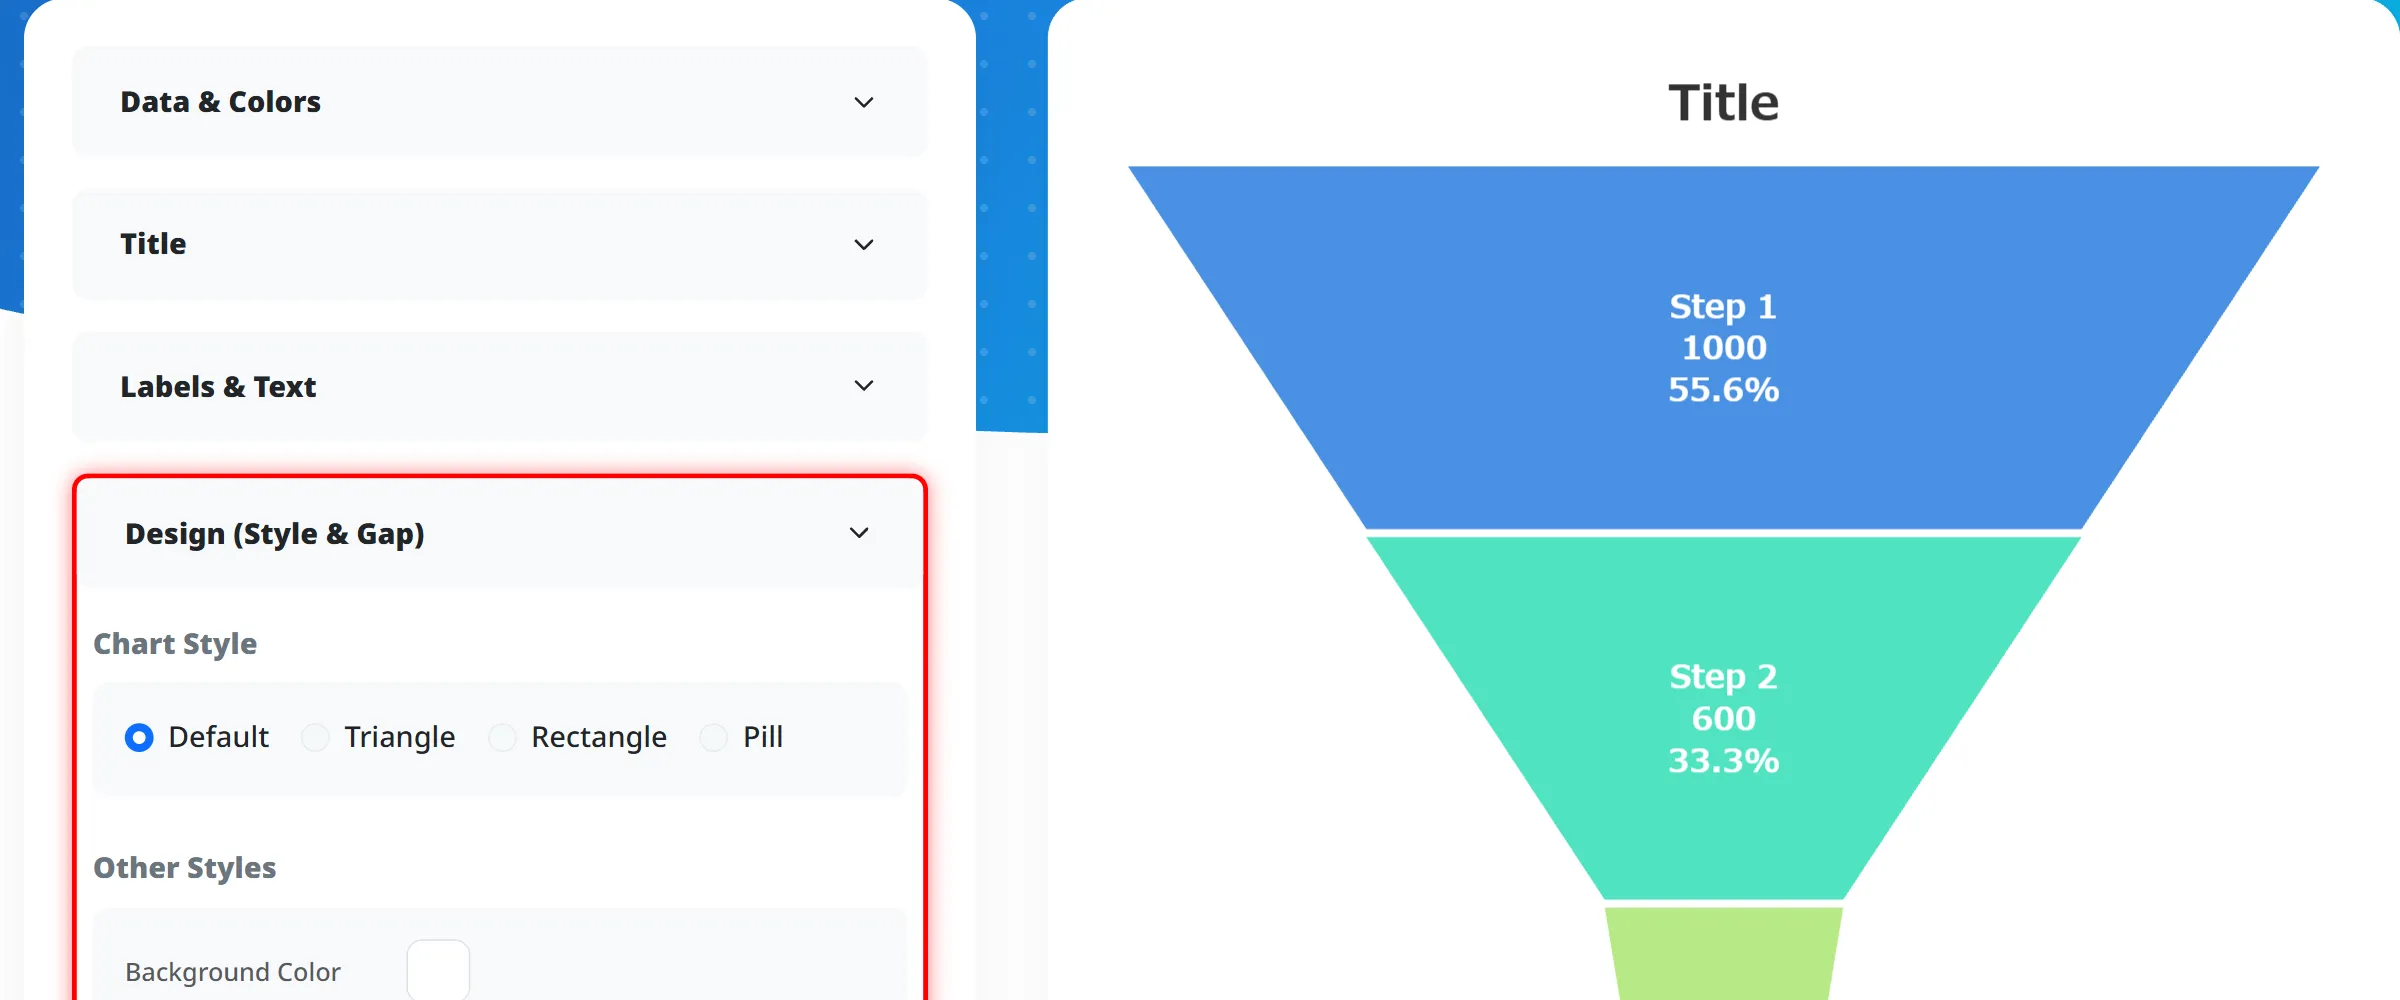
Customize Style and Retention
Choose from 4 chart styles: Inverted Triangle, Funnel, Capsule, or Rectangle. Enable "Show Retention Rate" to calculate and display step-over-step retention percentages between stages.
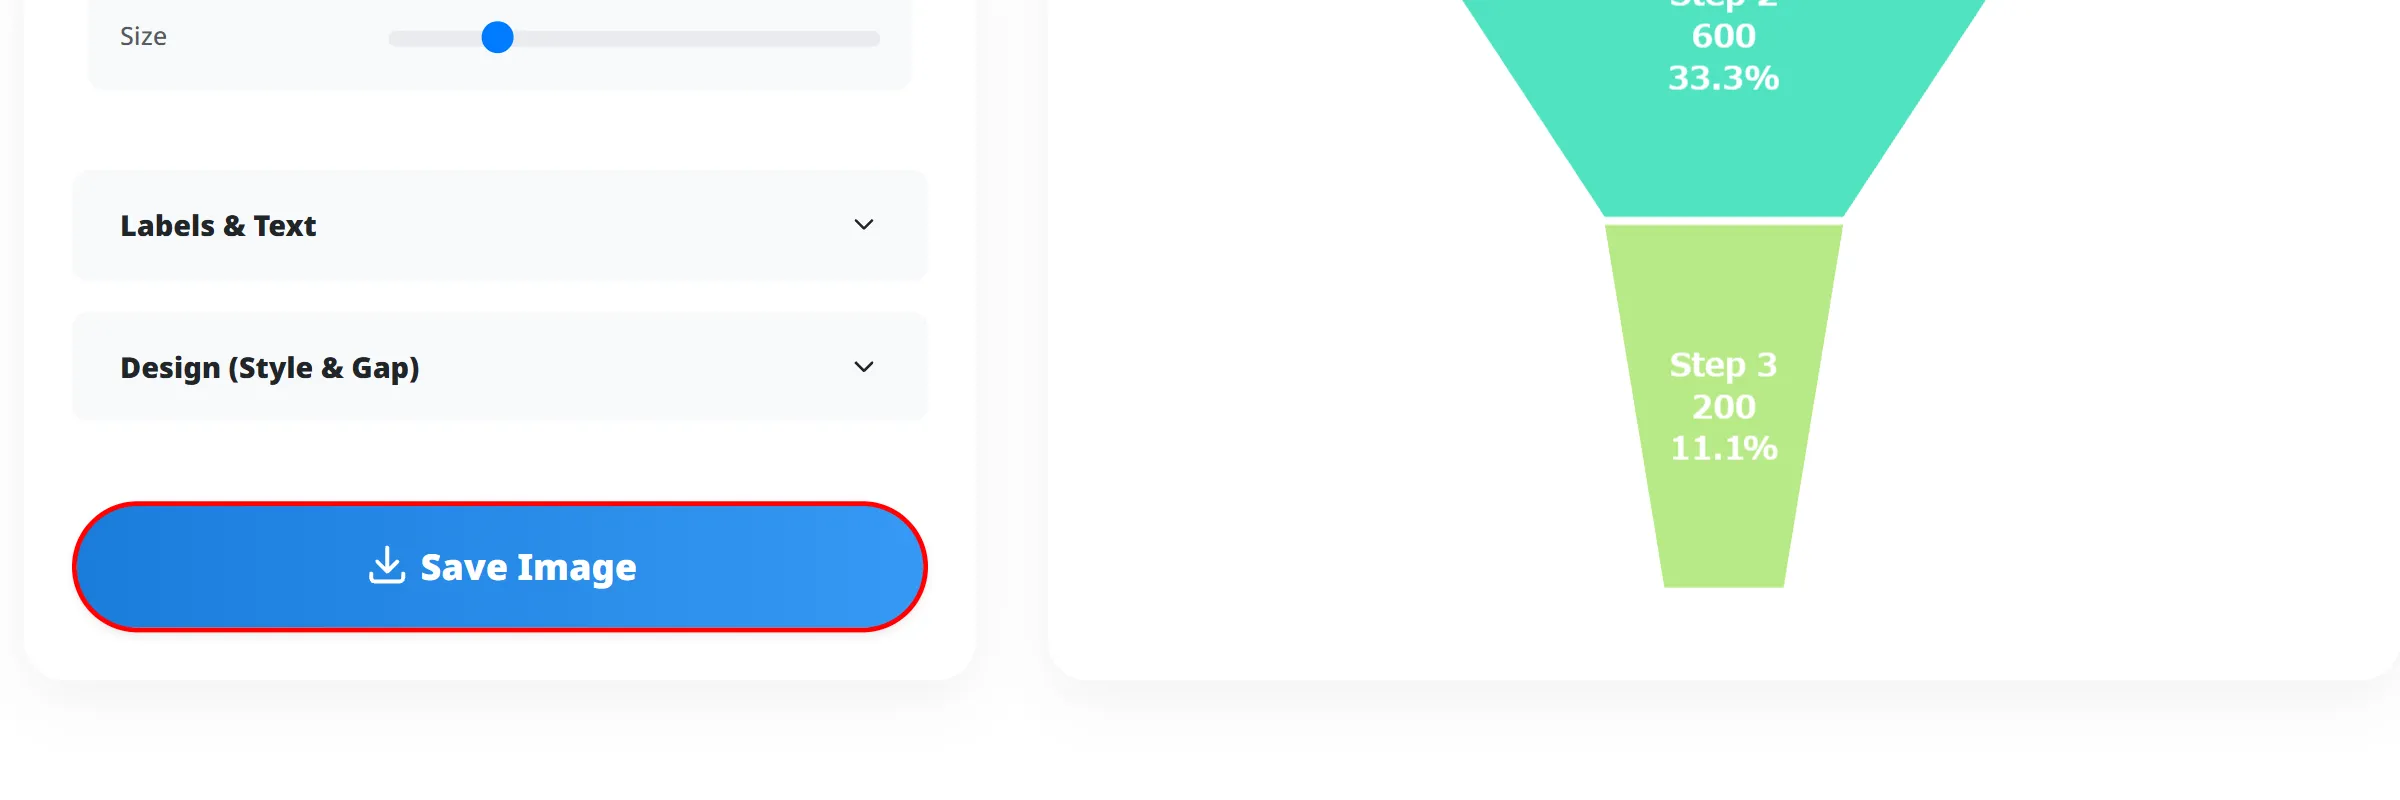
Copy to PowerPoint or Export PNG
Click "Copy Image" to copy the graphic directly to your clipboard for instant pasting into PowerPoint slides or Slack. Click "Save Image" to download high-resolution PNG files.
Direct Paste from Excel & Spreadsheets
Copy two columns from Excel or Google Sheets and paste them directly to populate chart stages instantly.
Automatic Step Retention Calculation
Calculate and display conversion rates from each previous stage alongside overall percentages.
4 Geometric Chart Styles (Inverted Pyramid & More)
Select sharp inverted triangles, classic funnels, rounded capsules, or horizontal rectangles to match your presentation deck.
Clipboard Image Copy & PNG Export
Copy the generated diagram to your clipboard with one click or download crisp PNG images for reports.
6 Professional Color Palettes
Apply tailored palettes including Business Blue, Dark Mode, Emerald, and Modern gradients with one click.
Complete Client-Side Privacy
All calculations and rendering run entirely in your local browser. Sensitive business metrics are never sent to external servers.
Free & No Registration Required
Access all customization settings and export tools instantly without account creation or subscriptions.
Optimized for Desktop & Mobile
Features a responsive layout that adapts seamlessly across smartphones, tablets, and widescreen displays.
Marketing Funnel & Conversion Tracking
Map out drop-off points from ad impressions, landing page visits, and sign-ups to final checkout purchases.
Sales Pipeline & Opportunity Stages
Track progression rates across lead qualification, discovery calls, proposals, and closed-won deals.
Recruitment & Hiring Funnel Analysis
Visualize candidate conversion from applications, resume screening, interviews, and final job offers.
What is a funnel chart used for?
Can I create a funnel chart if Excel lacks this chart type?
What is the difference between overall percentage and retention rate?
Is my internal business data secure?
How can I quickly insert the chart into PowerPoint or Google Slides?
Create funnel diagrams right from your browser without complex software. Paste tabular data from Excel, toggle between inverted triangles and classic funnels, track stage-by-stage retention, and copy directly into presentation decks.
Create your funnel chart now — free in your browser.