Create Stylish Pie Charts with Ease!
Visualize data proportions intuitively with this browser-based pie and donut chart maker. Whether you need to show survey results or budget breakdowns, you can easily customize legend placements and slice colors with a few clicks. Download your finished charts instantly as high-quality PNG images. No installation or account registration is required.
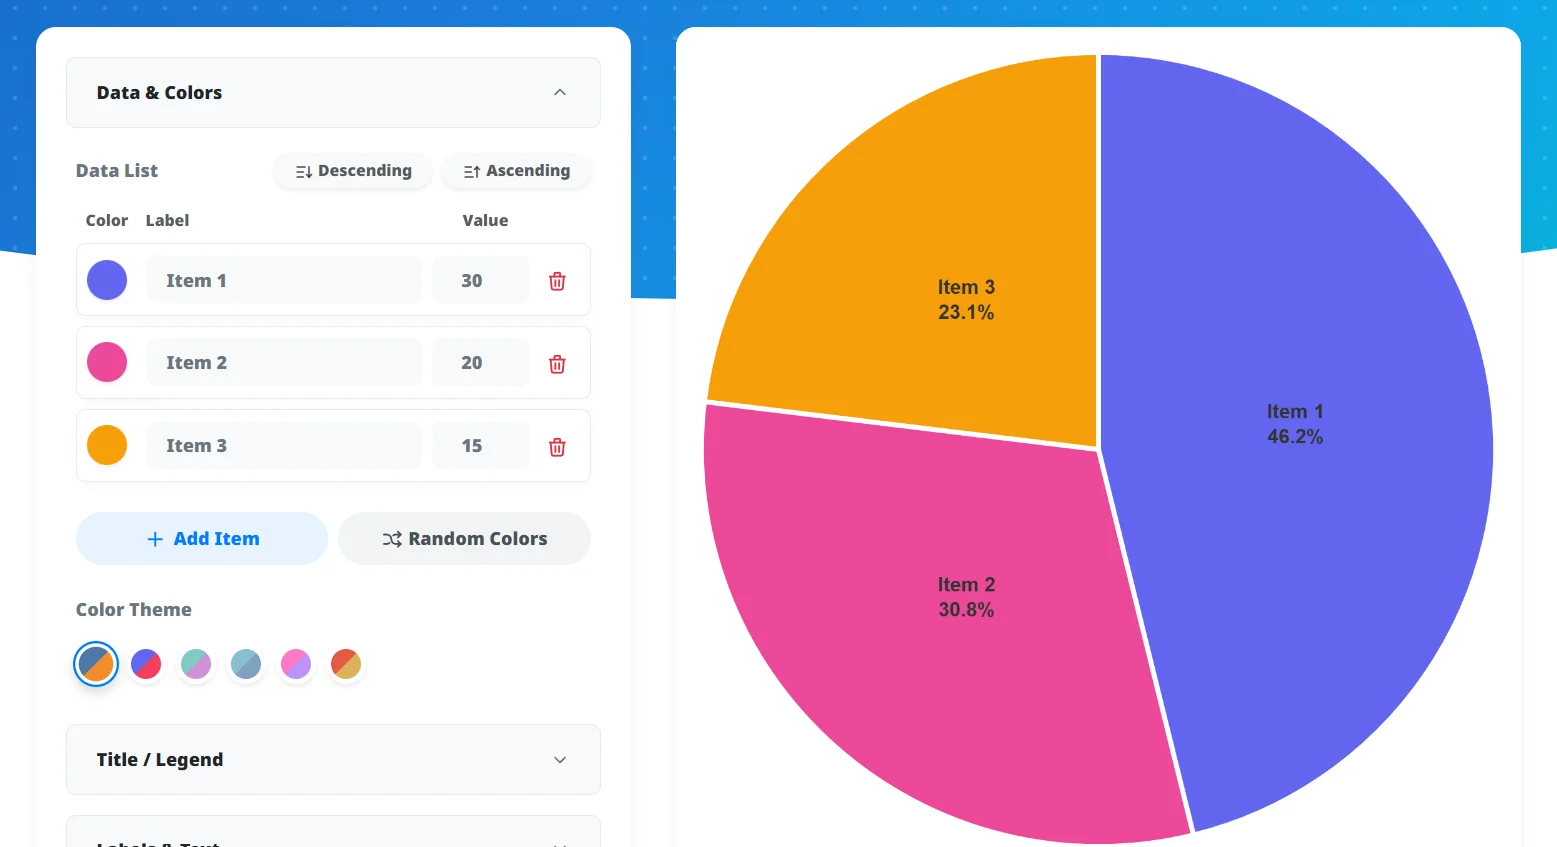
Input Chart Data
First, enter the data for your pie chart. In the 'Input Data' section, set the 'Color,' 'Label,' and 'Value' for each item. You can freely add or delete items, and use the 'Random Colors' button to easily set chart colors automatically.
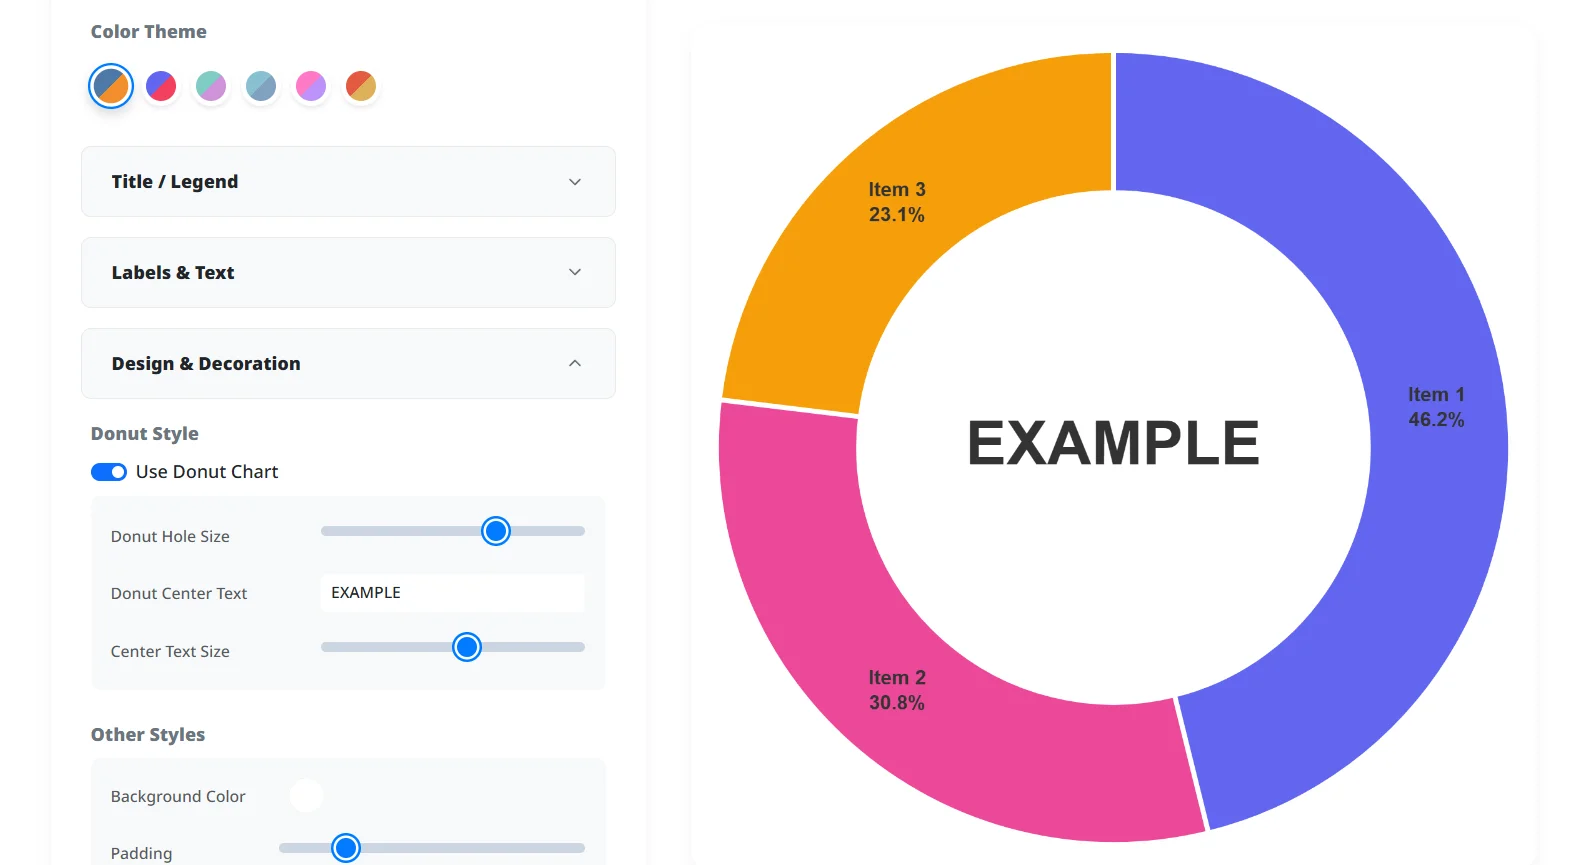
Customize Design
Fine-tune your chart's design to match your vision. You can easily adjust basic settings like the "Title" and "Legend", as well as toggle the display of values or percentages, and change text colors and sizes. In the "Design & Decoration" section, you can modify border widths and colors, or even rotate the chart. Turn on "Use Donut Style" to effortlessly switch to a donut chart!
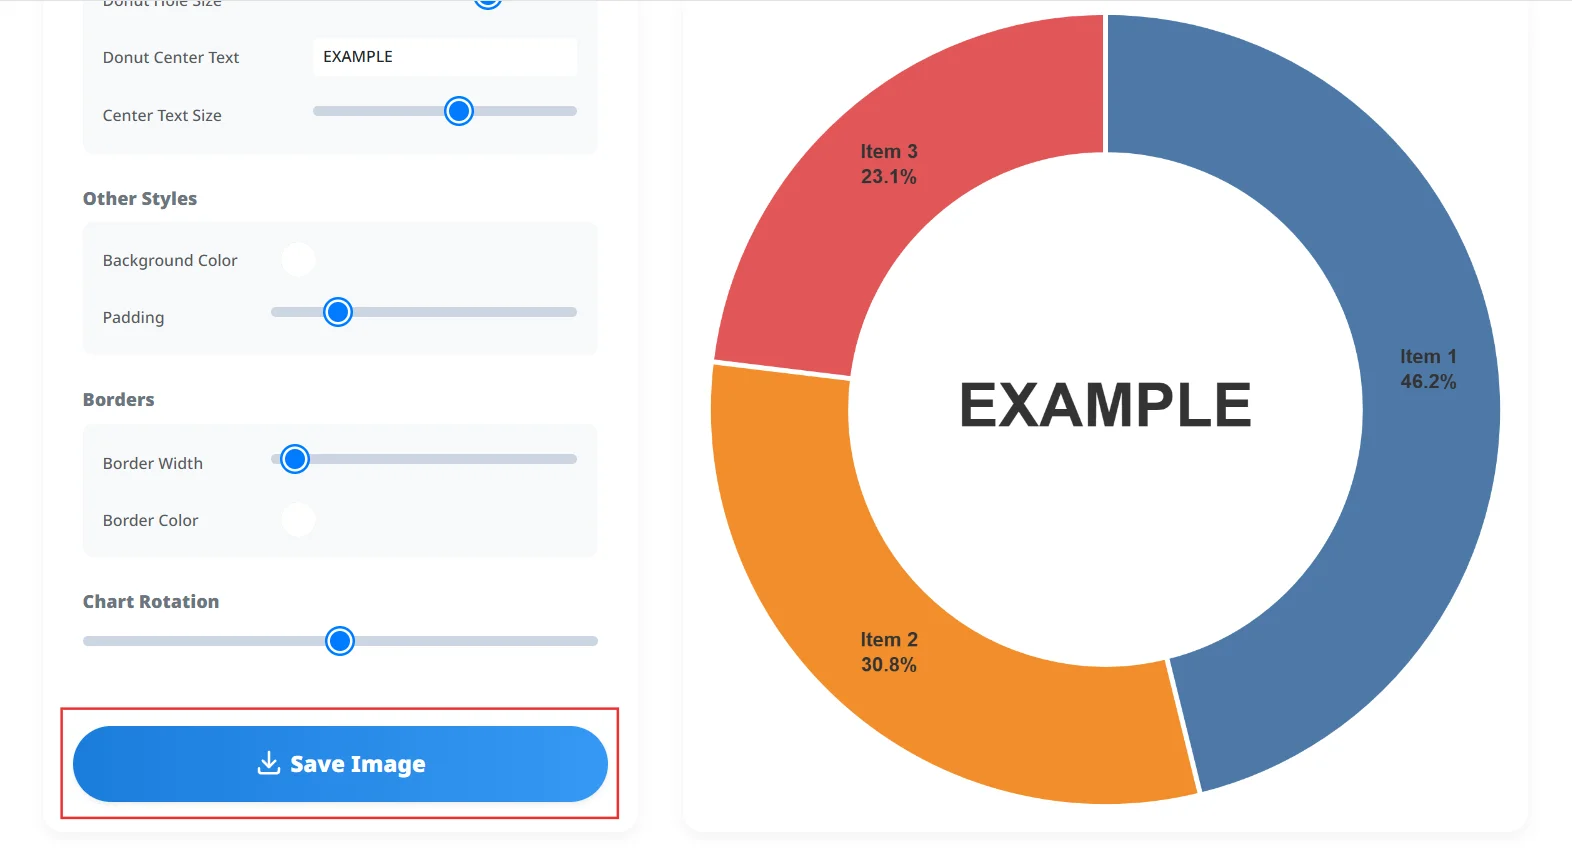
Save & Share Image
Once your design is complete, click the 'Save Image' or download button to save your pie chart as a PNG image. On smartphones, you can also use the share button to directly share it via social media or email.
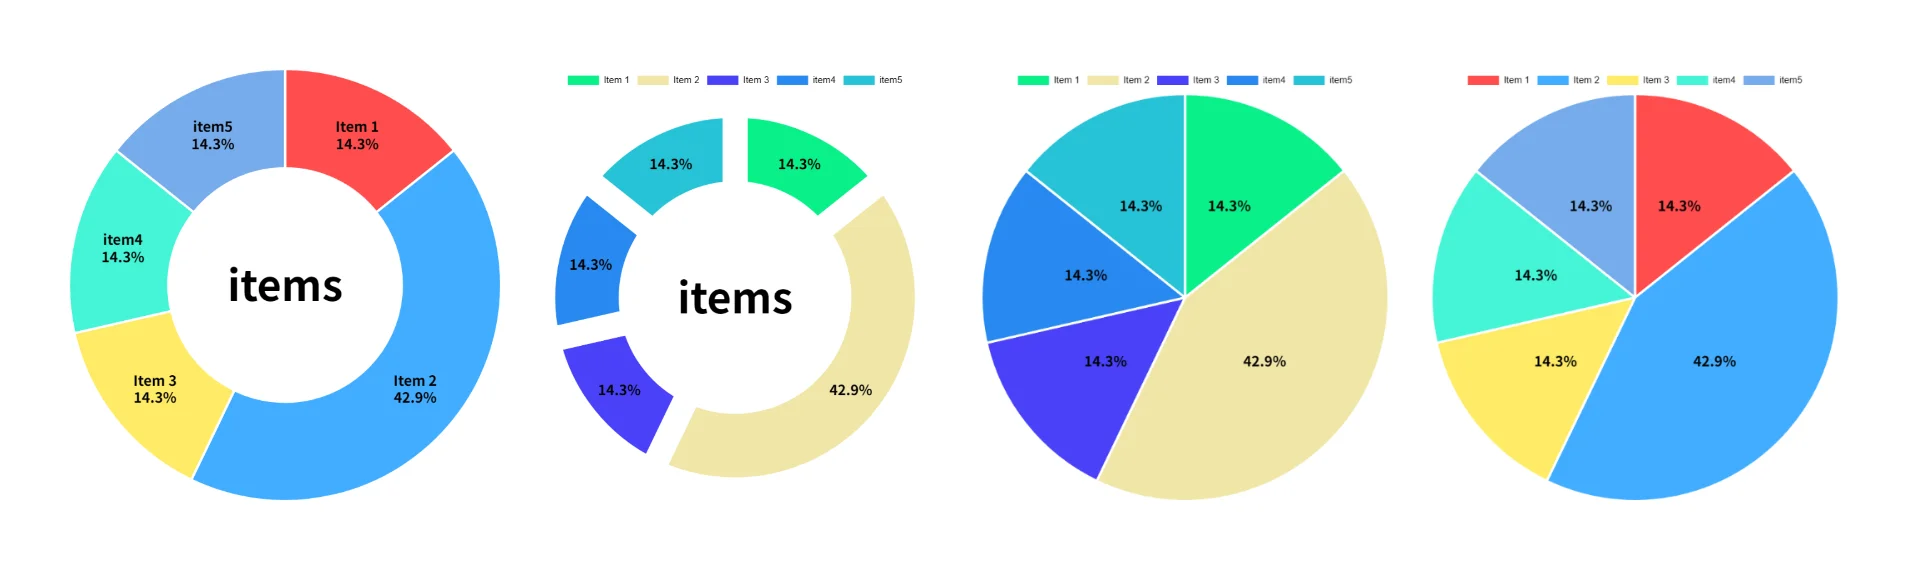
Visualize Proportions Intuitively
Simply enter item names and values to automatically calculate percentages and instantly generate a presentation-ready pie chart.
Versatile Design Customization
Adjust legend positions, percentage labels, slice colors, and more to perfectly match your specific use case.
One-Touch Donut Chart Conversion
Instantly transform your pie chart into a modern donut chart with center text by just toggling a switch.
Save as High-Quality PNG
Download your completed chart with a single click as a transparent PNG image, ready to be seamlessly pasted into your slides.
Completely Free & No Registration
Enjoy all features for free without the hassle of creating an account.
Browser-Based Convenience
Works perfectly in your browser on both PC and mobile devices without installing any apps.
Easy Sharing via Socials or Email
Directly share your created charts to social media or via email right from your smartphone.
Secure Local Processing
Your data is never sent to our servers, ensuring completely safe usage even for confidential information.
Communicate Data Proportions Clearly
Transform survey results and sales breakdowns into intuitive pie charts that strengthen the persuasiveness of your documents.
Enhance Blogs and Reports
Embed visually impactful donut charts into your articles to deepen reader understanding.
Highlight Specific Data Points
Easily create charts that emphasize your core message by offsetting (pulling out) specific slices.
Completely Free High-Quality Images
Quickly create beautiful charts without paying for premium software.
Intuitive Mobile Chart Creation
Intuitively create and share charts directly from your smartphone browser.
Can I use it on my smartphone?
What image format is used for saving?
Are there any limits on the number of data input items?
Can I create a donut chart?
With Boost Tool's pie chart maker, you can intuitively visualize percentage data right in your browser. Features like switching to a donut style or offsetting individual slices help you highlight the specific numbers that matter most. Elevate the quality of your daily reports and presentations effortlessly.
Let's create a pie chart easily!