Free Online Bar Chart Maker
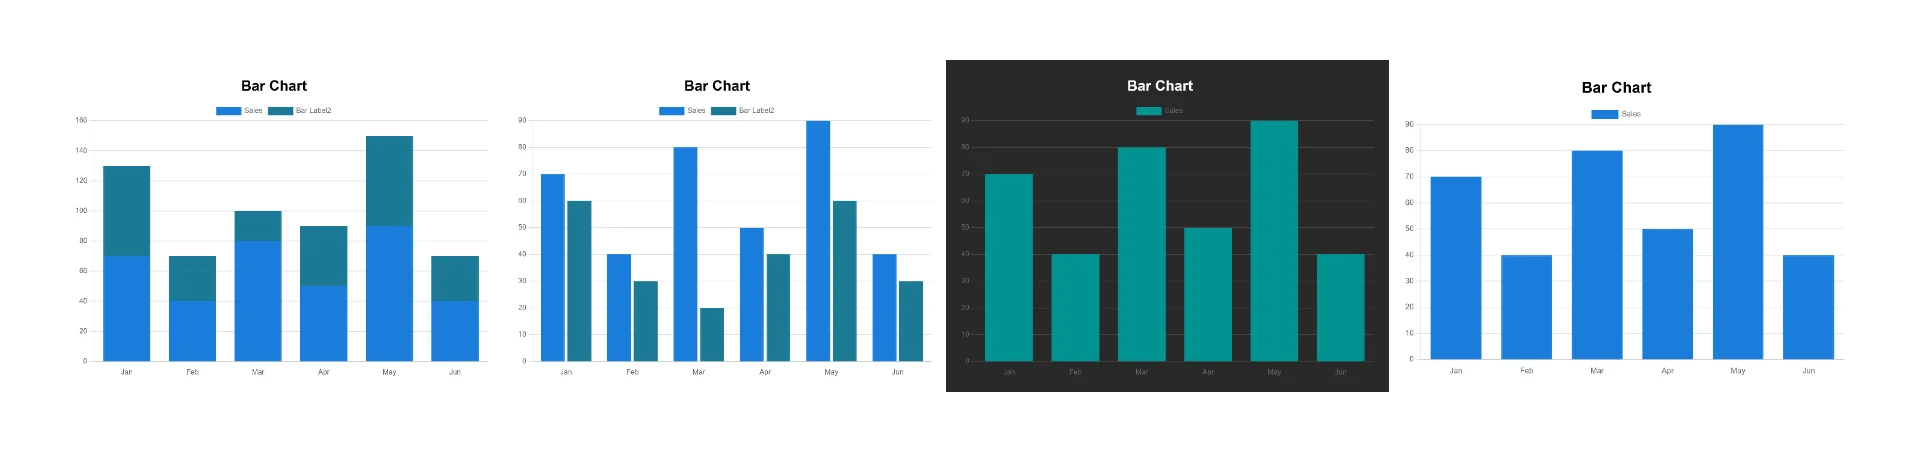
An online tool designed to easily create vertical and horizontal bar charts for clear data comparison. Simply input your numerical values and categories to visually represent sales data, survey results, or performance metrics. You can switch to stacked bar charts to show part-to-whole relationships, or change to horizontal bars for long labels. Apply professional color themes and download your finished chart instantly as a high-resolution PNG image. No account registration or installation is required.
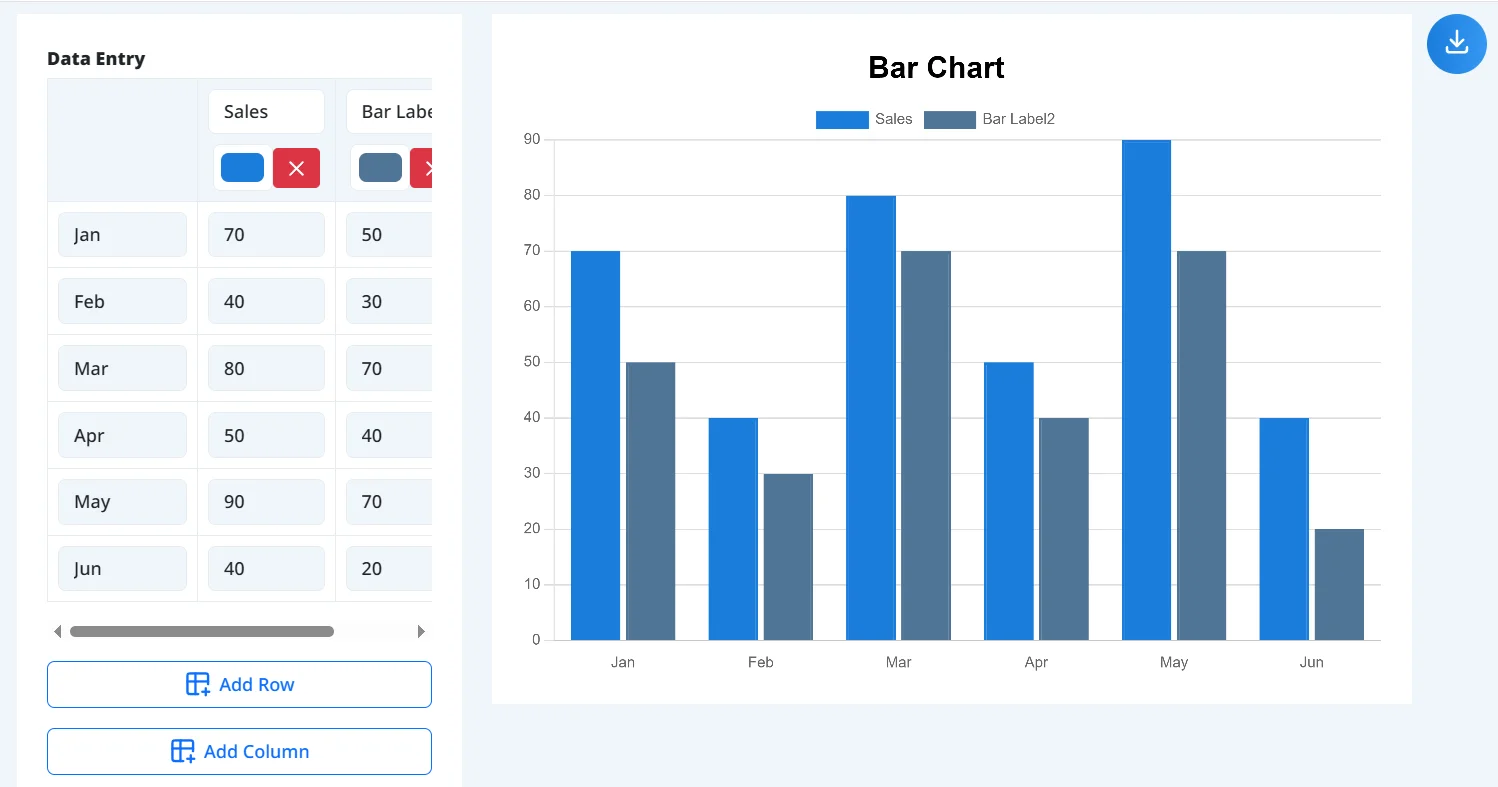
Enter Data
Enter numerical values into the table. Add columns to create multi-series bar charts.
You can also specify colors for each column.
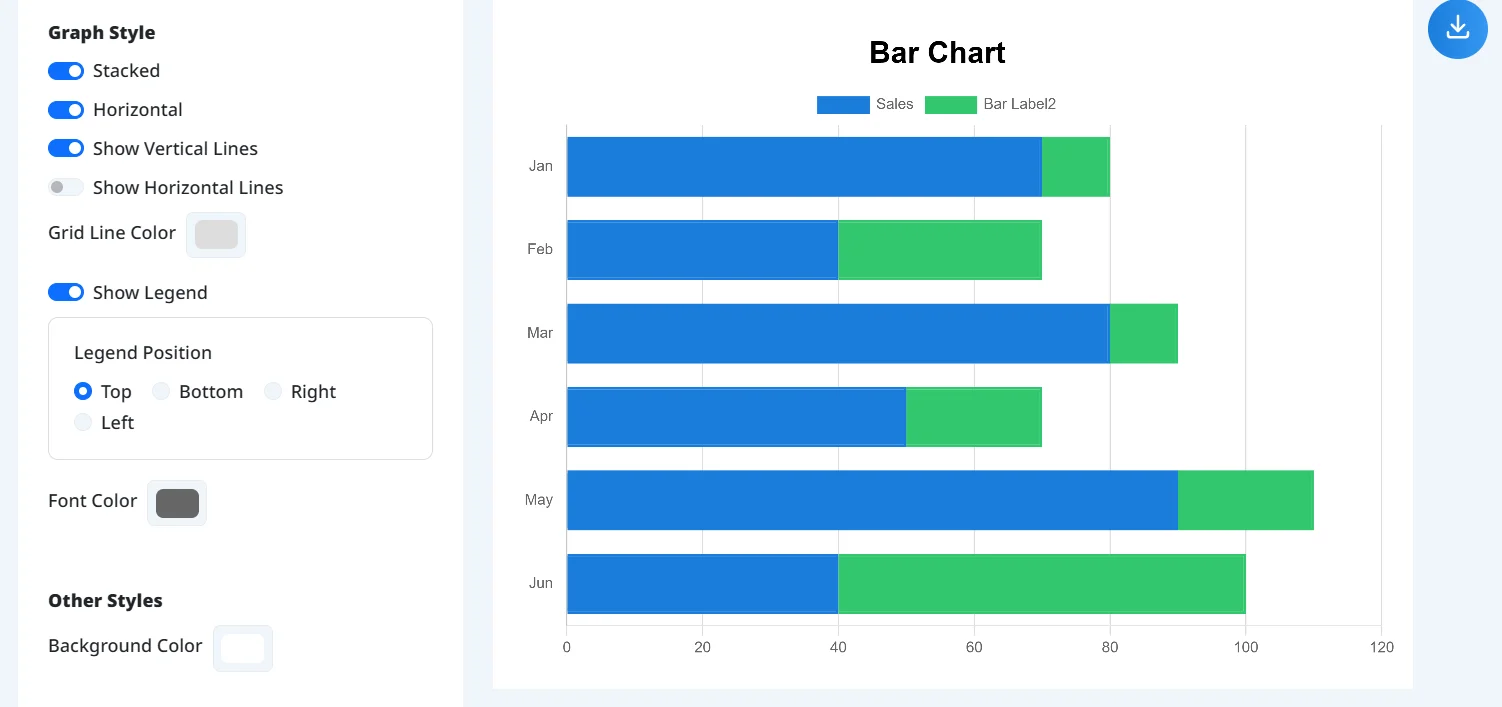
Set Graph Style
Freely set the chart title, legend position, background color, font color, and more.
You can highly customize your bar chart by making it stacked or switching to a horizontal layout.
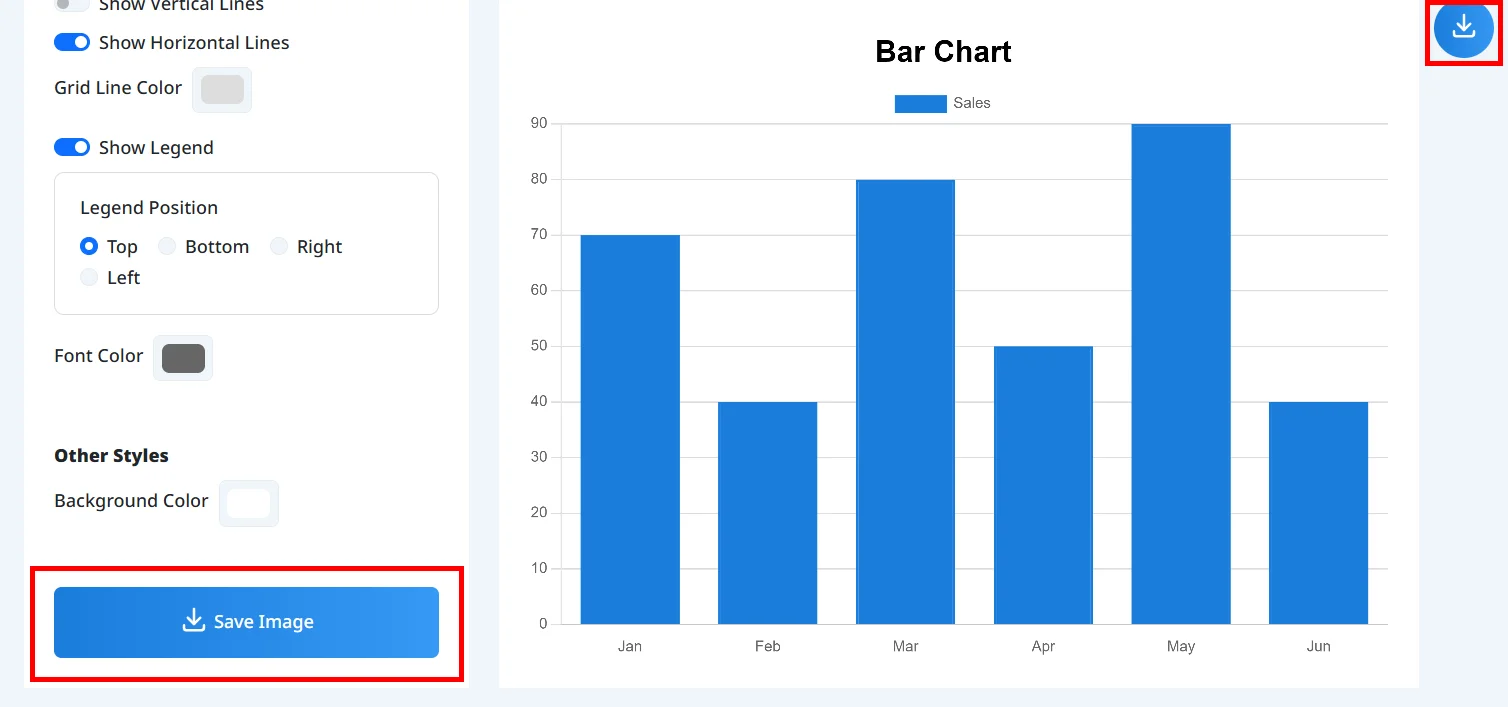
Save Image
Your created bar chart can be saved as a PNG image with a single click.
Utilize it for various purposes such as documents, presentations, or social media posts.
Instant Data Visualization
Enter your categories and numerical data to immediately generate a clean, modern bar chart that makes comparing values effortless.
Flexible Chart Layouts
Easily switch between standard vertical bars, horizontal bars for longer labels, or stacked bars to display cumulative data.
Professional Color Themes
Apply pre-designed, aesthetically pleasing color palettes with a single click to ensure your chart aligns with your presentation's design.
High-Resolution PNG Export
Download your customized chart as a crisp, high-quality PNG image, perfectly formatted for insertion into slides or printed reports.
Secure Local Processing
All data input and chart rendering occur directly in your browser, ensuring that your sensitive information is never sent to our servers.
Compare Sales and Performance
Create clear visuals that compare revenue, product performance, or regional metrics side-by-side.
Visualize Survey Results
Effectively map out questionnaire responses or demographic data using easy-to-read horizontal or stacked bars.
Enhance Business Reports
Generate professional-grade charts without the need for complex formatting in spreadsheet software, elevating your document's impact.
Create Visuals on Mobile
Quickly input data and generate charts directly from your smartphone, ideal for fast updates and sharing on the go.
Can I create bar charts for free?
In what format can I save the created bar charts?
Can I create horizontal bar charts in addition to vertical bar charts?
Does it support stacked bar charts?
Boost Tool's bar chart maker allows you to instantly visualize data sizes and comparisons with clarity. By adjusting the layout—whether vertical, horizontal, or stacked—you can tailor the chart to best fit the story your data tells. With intuitive customization options for grid lines, colors, and legends, it serves as a versatile solution for creating professional-grade visuals for business reports, academic presentations, or marketing materials, all directly within your web browser.
Create your bar charts now and make your data visually compelling!