Easily create stylish line charts with this free online tool.
This free online tool allows you to create beautiful line charts simply by entering your data. It's perfect for clearly visualizing various time-series data such as sales trends, growth records, household budgets, and health data. Accessible from PC and smartphone browsers, no registration required. Create line charts exactly to your liking.
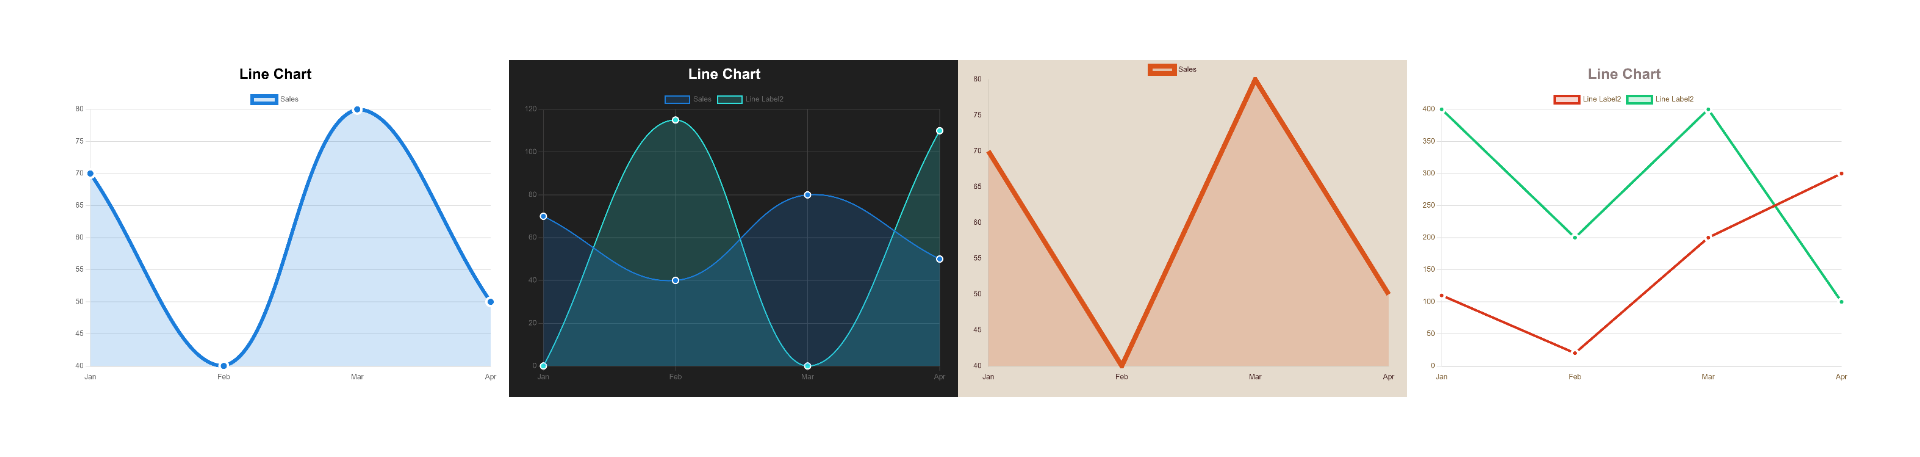
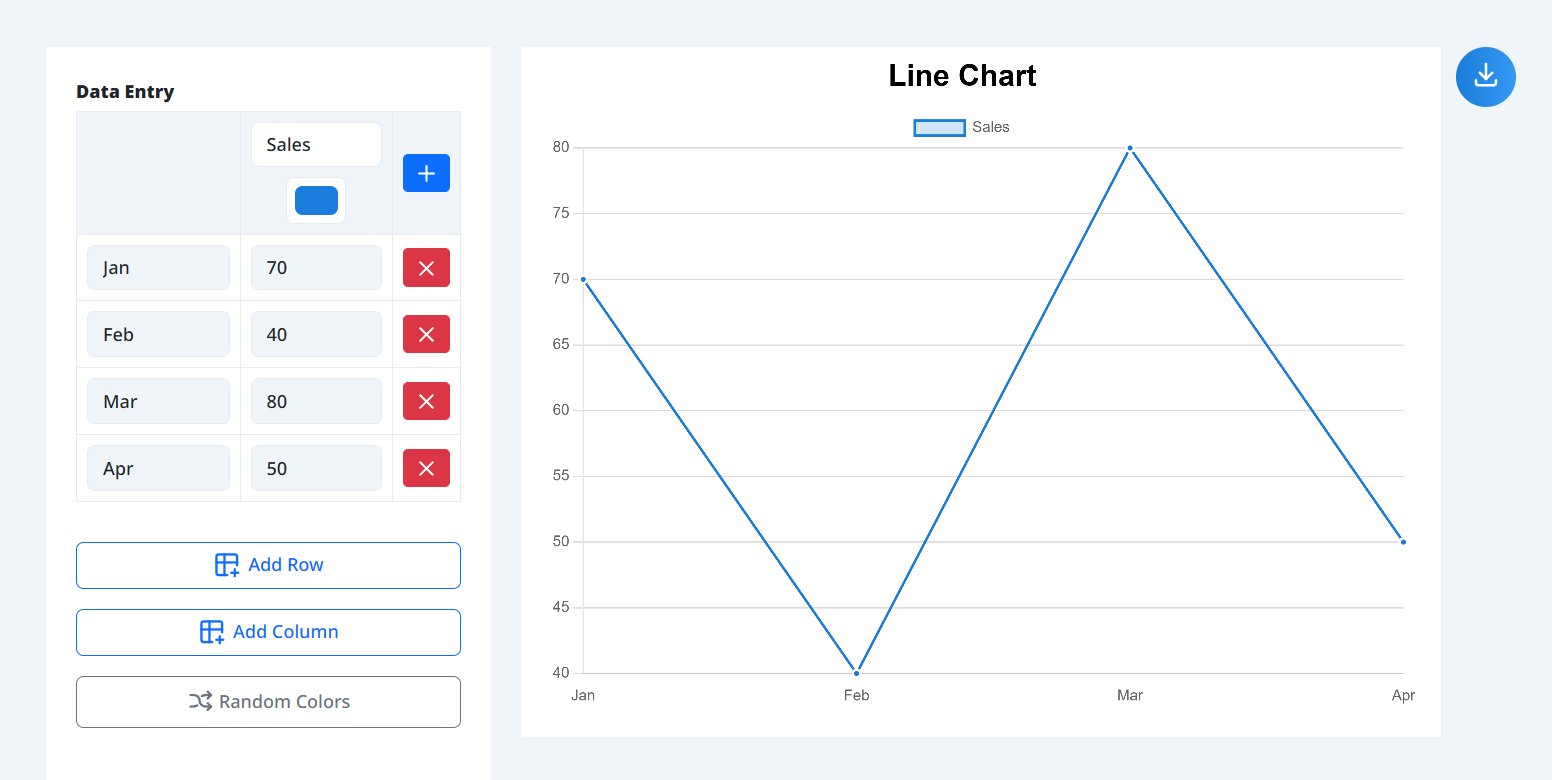
Simply input your desired values in a table format, and the line chart will be drawn automatically in real-time. You can add or delete rows and columns (lines) with a single click. The "Random Colors" feature for automatic line coloring is also very convenient.
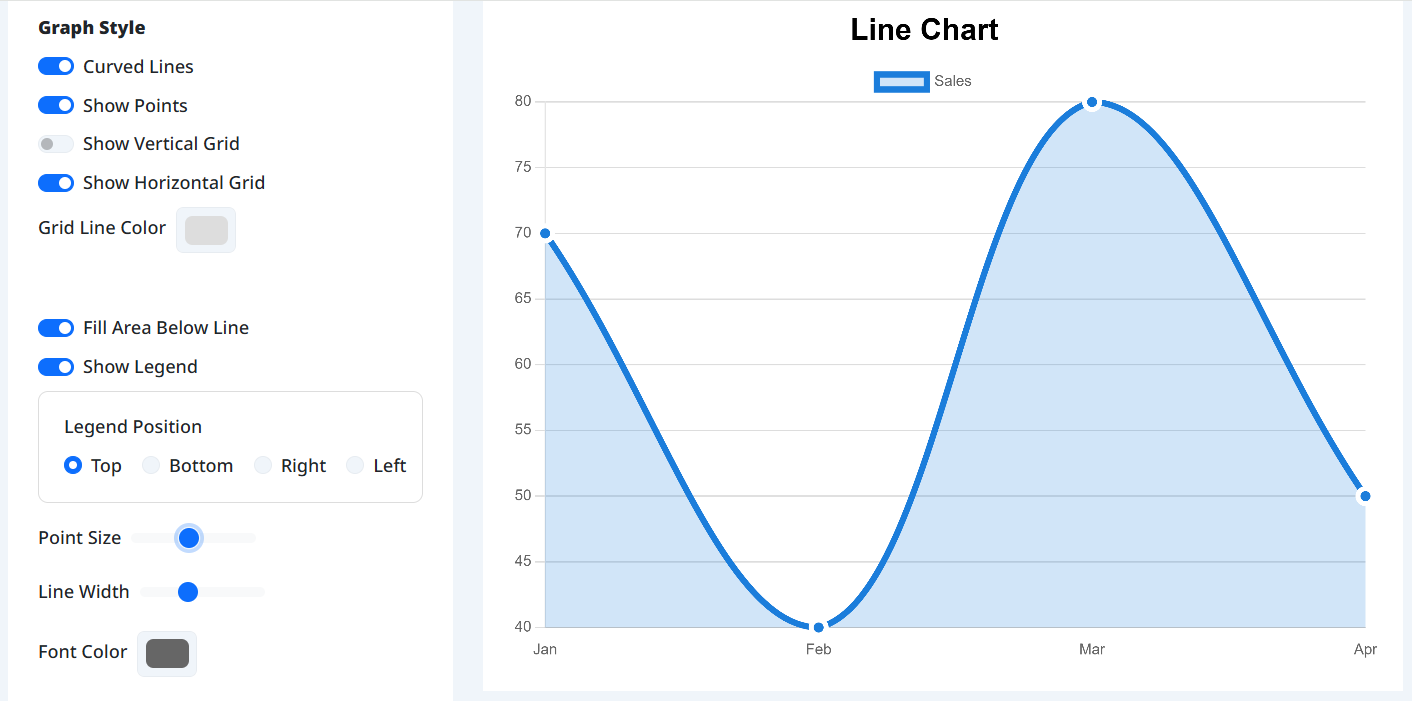
In the options, you can make lines curved, fill the area below lines, and freely change the display position of titles and legends. You can also fine-tune the line width, point size, and font color, allowing you to adjust the design to suit your purpose and preference.
Once finished, click "Save Image" to download it as a high-quality PNG. On smartphones, you can directly post to social media or email using the "Share" function.

Simply enter your data and labels to instantly create stunning line charts perfect for any presentation or website.
Customize line width, colors, background, and text size down to the finest detail to match your brand.
Easily fill the area under your line to create striking area charts that emphasize data volume.
Control the look of your chart from sharp straight lines to smooth, flowing curves (Bézier curves).
Save your finished chart as a high-quality PNG image with a single click, ready for your slides.
Access all features for free directly in your browser, with absolutely no account creation required.
Those who want to upgrade from standard Excel charts to more stylish, modern visuals.
Writers who want to clearly visualize trends and statistics for their audience.
Anyone looking to chart changes over time, like sales growth, website traffic, or personal metrics.
People who need to quickly create and save charts directly from their smartphone.
Those who want to create beautiful charts without installing expensive or complicated software.